Table Filter, Charts & Spreadsheets for Confluence by Stiltsoft

More data, more problems. Eventually, just about every enterprise discovers that the cosmic-sized amount of data used for collaborative knowledge sharing in Confluence can become unmanageable and requires proper organization.
But navigating and managing your Confluence instance can be challenging. Out-of-the-box Confluence features might not always provide you with all the tools to achieve the desired result.

Unleash Cosmic Clarity in Confluence
That's why companies use the Table Filter, Charts & Spreadsheets for Confluence app developed by Stiltsoft, an Atlassian Platinum Marketplace Partner and Silver Solution Partner.
This app makes it easy to filter complex Confluence tables, aggregate data in pivot table reports, build dynamic Confluence charts on the fly, repurpose tabular data on different pages, or use spreadsheets with predefined formulas. Combined with native Confluence features, the app gives you plenty of opportunities for table customization, data analysis, and visualization.

Filtering Confluence Tables
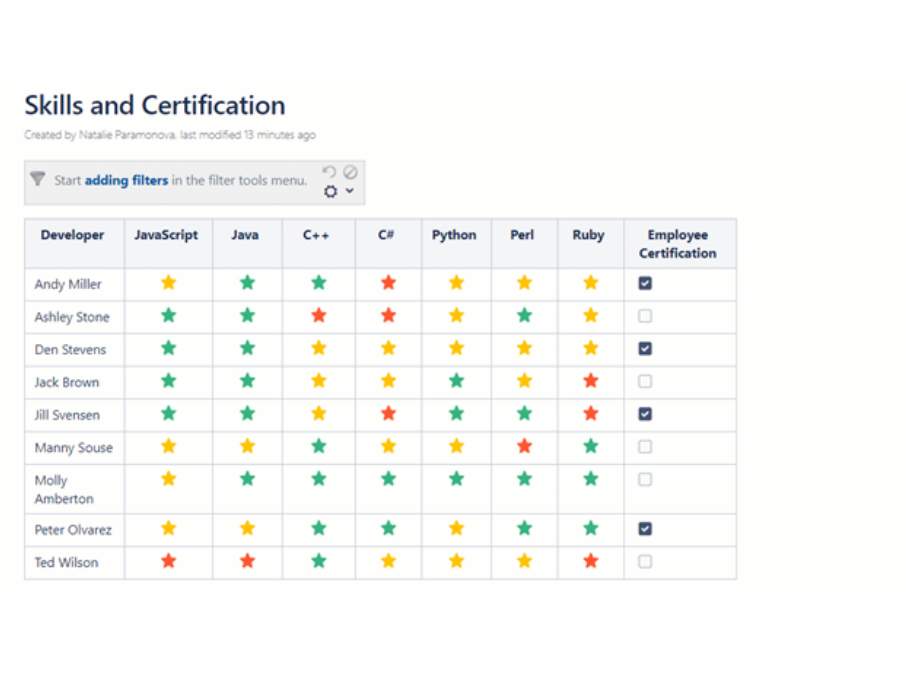
Filtration is a vital part of managing vast data in large tables. With the app, you can apply filters to your table columns in one click. The most relevant type of filter will be automatically applied after you add the macro. The design and the source of tables may vary, but you can use the app on any of them.
Here are just a few examples of the tables you can filter using the app:
- Regular Confluence tables of any size and design. These include tables with merged or missing cells, tables containing statuses, and generally any custom transformations.
- Macro-generated tables. You can use the Page Properties and Page Properties Report macros to gather data from various tables in one place. Or maybe your team tracks tasks in Jira while you output this data in Confluence with the Jira macro for further usage. Or you might reuse the whole table many times with the app’s Table Excerpt and Table Excerpt Include macros. Whatever the source table is, you can get exactly what you need from it.
- Tables derived from files. You can attach the CSV or JSON file to your page and depict the table with the help of the Table from CSV or Table from JSON macros provided by Table Filter, Charts & Spreadsheets for Confluence. Next, choose the filters to apply to its columns.
- Tables generated by third-party apps. Even if you use multiple apps in your Confluence instance, you can still achieve the desired result with the app.
Apart from filtration, you can aggregate and analyze tabular data or turn it into a dynamic chart too.

Creating Powerful Dashboards
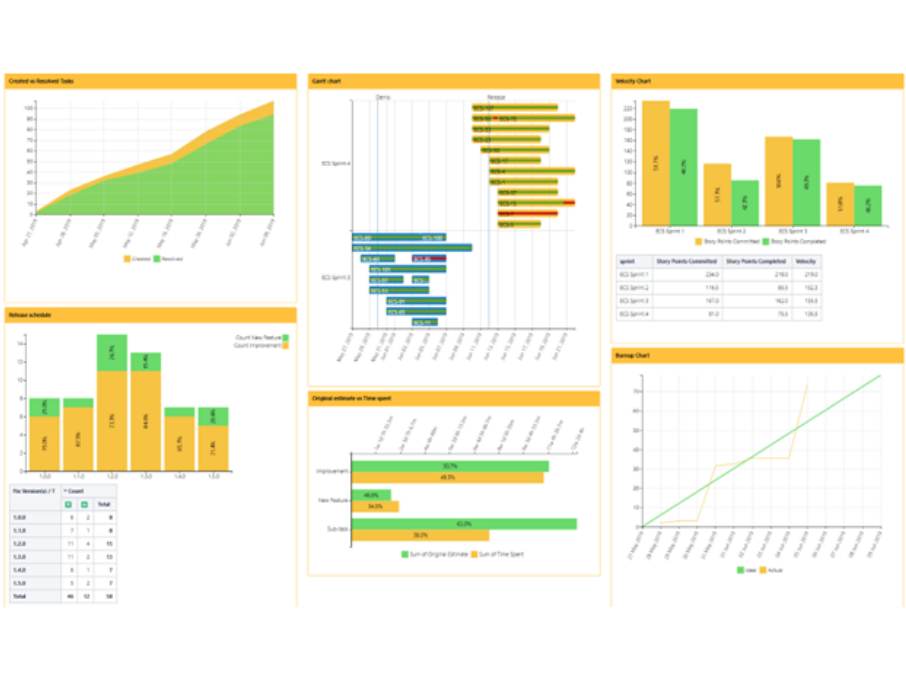
If you want a comprehensive command center of your data or need to share insights, you can build a dashboard. Using just one table, you can analyze it from various perspectives by creating multiple charts and pivot tables.
Moreover, if you update the source table, the dashboard will update too. It becomes possible with the help of the Table Excerpt and Table Excerpt Include macros.
Working with Spreadsheets in Confluence
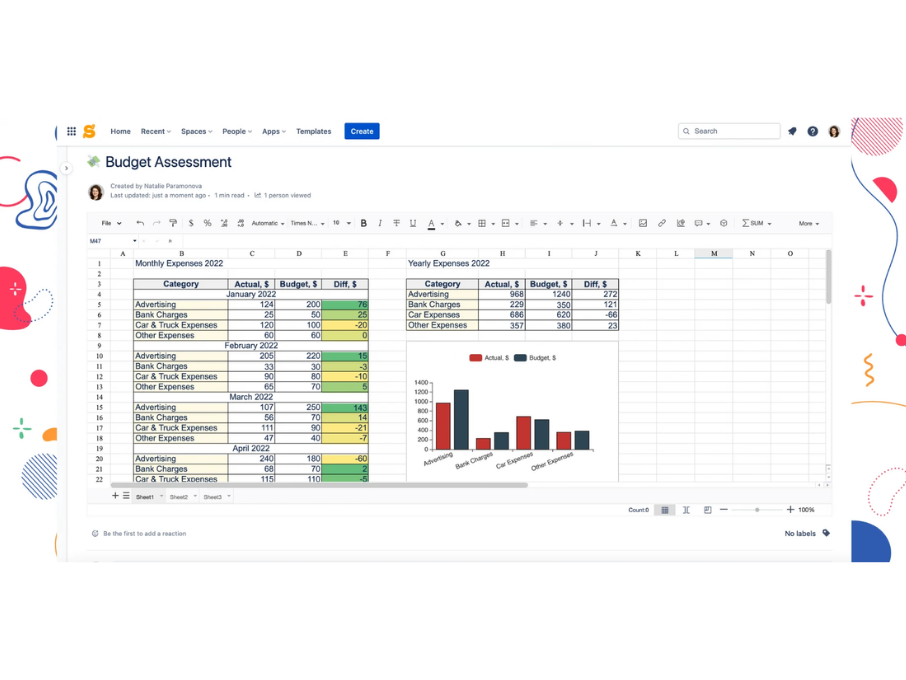
Even though the functionality of Confluence tables enhanced by the app is enough to achieve any desired result, many users still miss the abilities and the interface of Excel tables. So, use the Table Spreadsheet macro to access all of the Excel features while working in Confluence. It allows you to embed a spreadsheet onto your Confluence page and keep working with it both in the edit and the view mode.
Also turn any Confluence tables into spreadsheets and share bits of spreadsheet data across your Confluence instance. The spreadsheets are easy to customize and have an extensive array of tools. You can choose settings for the text and data, use predefined formulas and conditional formatting, perform calculations and create charts and graphs.

Explore Data Nebulas with Table Filter, Charts & Spreadsheets for Confluence
Here are just a few reasons why you might want to try Table Filter, Charts & Spreadsheets for
Confluence:
● To enhance native Confluence features and accomplish more in no time.
● To organize, reuse and analyze table data.
● To discover a new approach to managing Confluence tables.
● To replace some of your favorite Excel or Google Sheets features.
Launch into a new era of data management and collaboration with Table Filter, Charts & Spreadsheets app. Prepare for a journey where every piece of data aligns like stars in the galaxy, enhancing your team's productivity and decision-making across the universe.