Gantt Chart Planner for Confluence by Ricksoft

In the vast expanse of project management, visualizing your project plan is not just beneficial; it's critical. Without a clear map, managing a project can feel like an astronaut stranded in space, unsure of where to go next or how to reach their destination. A well-visualized project plan acts as your star map, guiding you through the project's lifecycle, ensuring every team member is aligned and every task is on track.
The native Confluence roadmap macro, while a starting point, often falls short, akin to navigating the stars without a telescope. Missing crucial features like critical path view, it leaves teams ill-equipped for detailed planning and anticipating delays.

Charting Your Project's Course with Gantt Chart Planner for Confluence
Enter Gantt Chart Planner for Confluence.
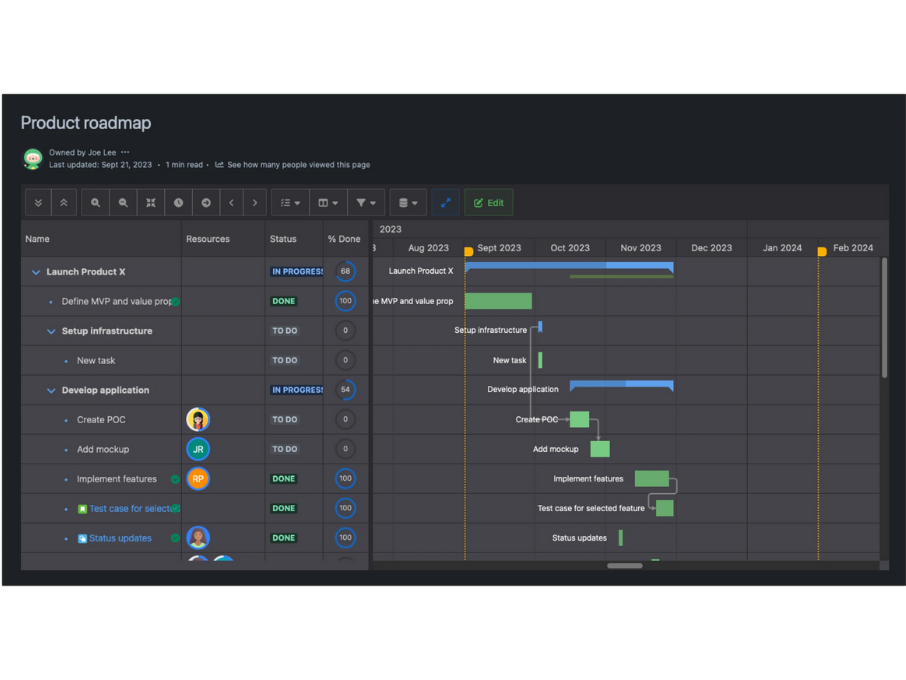
The app brings your project to life, laying out tasks, resources, milestones, and dependencies. And it’s embedded directly on your Confluence page like any standard macro.
Along with the work breakdown structure, you’ll have the high-level timeline view, with each bar representing a task. It also indicates the task duration to aggregate the overall completion timeline for you.
No more chasing deadlines or scrambling to meet last-minute changes. By enabling the critical path view, Gantt chart helps reveal potential bottlenecks before they arise, allowing you to adjust your plan proactively. You can even map out dependencies to prioritize the sequential order across all deliverables.

Visualize Project Delivery with Jira Integration
The app also integrates seamlessly with Jira to enable cross-platform collaboration. It instantly syncs task duration from Jira so you can adapt your plan to actual delivery progress - there’s no need to switch between Jira and Confluence platforms.
There are three methods to connect Jira issues:
● Insert existing Jira issue into the Gantt chart planner
● Link existing Jira issue to a task on your Gantt chart
● Create a new Jira task from Gantt chart
It can also accommodate portfolio-level planning by connecting the Gantt chart with multiple Jira sites or projects. You can use the app to visualize major project timelines across different teams, for instance, on a central project space.
This is useful if you want to initiate a high-level yearly plan without necessarily committing to specific deliverables. At the same time, you can ensure that the progress is automatically updated as the team starts working on them.

Steering Toward Success: The Impact of Clear Visualization
Now, the command deck is more organized than ever, with both Jira and non-Jira tasks plotted in a single, cohesive project plan.
The app’s visual essence makes it quick and intuitive to track progress and adapt your plan, to ensure a smooth journey across all project deliverables.